What is a phase diagram?
The state of a substance depends on pressure as well as temperature. A phase diagram shows both effects on one graph. The horizontal axis is temperature T, and the vertical axis is pressure P. Each point on the diagram stands for a specific set of conditions.
| Part of the diagram | What it shows |
|---|---|
| The three regions: solid, liquid, and gas | Under these conditions, the substance is in one state |
| The lines between regions | Two states exist together: the melting, vaporization, and sublimation lines |
| The triple point | All three states exist together |
At pressures below the triple point, a substance cannot be a liquid. At such a pressure, a solid turns directly into a gas when you heat it. This is called sublimation. The triple point of water is at about 0.01 °C and 0.6 kPa.
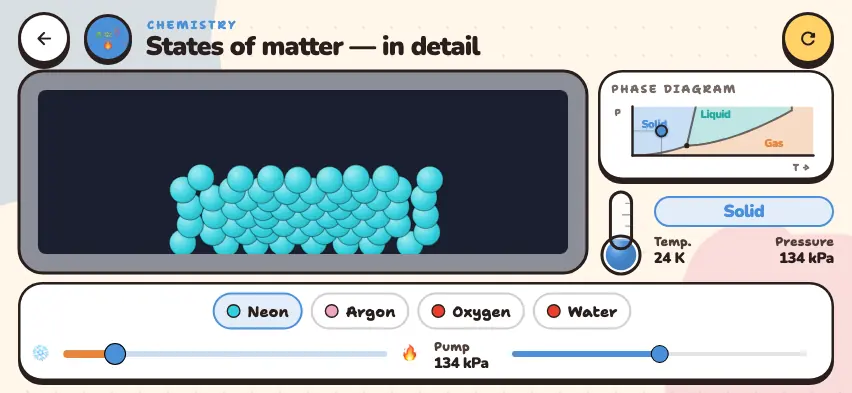
Move the dot across the diagram
Heat and compress a substance and see whether it enters the solid, liquid, or gas region. This simulator is included with full access. Downloading is free, and 2 units and 5 simulators are open without signing up.
How do you use the simulator?
- Choose a substance in the bottom row: Neon, Argon, Oxygen, or Water.
- Move the left slider from the ❄ symbol toward the 🔥 symbol to heat the substance. The dot on the diagram moves to the right.
- Use the Pump slider to change the pressure. The dot moves up or down.
- Read the state of the substance, Temp., and Pressure on the right panel.
- In the container on the left, the particles move according to the new state.
Tasks to try in the simulator
- From the starting state, only heat the substance. Answer: The dot moves to the right and crosses the solid, liquid, and gas regions in turn.
- Move the Pump slider to the left until the dot is slightly lower than the small black dot. Now heat the substance. Answer: The dot passes below the triple point, and the substance turns directly into a gas without becoming a liquid.
- Move the dot into the gas region, to the right of the liquid region, and increase the pressure. Answer: The dot moves up into the liquid region. You have liquefied a gas by compressing it.
- Heat the substance as much as you can and set Pump to the maximum. Answer: The substance stays a gas. Above the critical temperature, you cannot liquefy a gas by compression alone.
Real-life examples of phase diagrams
- Boiling at high altitude. At high altitude, air pressure is low, so water boils before it reaches 100 °C. In Ulaanbaatar, too, water boils at a temperature below 100 °C.
- Dry ice. The triple point of CO2 is at a pressure above 1 atm. So at normal pressure, dry ice does not melt. It turns directly into a gas.
- Frozen clothes. Clothes hung outside in winter freeze and then dry without thawing. This is the sublimation of ice.
- Gas cylinders. Propane and butane are gases under ordinary conditions, but inside a cylinder they are liquids under high pressure.
What to keep in mind when you read the diagram in the simulator
The diagram in the simulator is one general scheme that is the same for all substances.
- When you change the substance, the diagram does not change. Only the number on the thermometer and the look of the particles change.
- The positions of the lines do not exactly match the number on the thermometer. For example, at 134 kPa, the simulator shows water as a solid at 300 K, but in reality it is a liquid. For exact values, read the melting and boiling point guide.
- The real melting line of water tilts to the left: when pressure increases, ice melts at a slightly lower temperature. The line in the simulator tilts to the right, as it does for most substances.